
MODULAR MEDICINE MANUFACTURING
The factory
in the box.
A hospital needs medicine. Fill a fictional batch and see why the containers still need review before they can ship.
REAL CASE · U.S., 2011
Production interruptions at three manufacturers disrupted supplies of norepinephrine, a medicine used in critical care.
Why this case? Sources & limits
Vail et al., JAMA (2017) documents the historical shortage. It does not identify filling as the specific bottleneck.
In a separate 7 March 2024 announcement, CHS named norepinephrine among the medicines it planned to buy from Cost Plus’s Dallas fill-finish operation. That is not evidence for a portable pod or its performance.
Our walkthrough starts at filling: it assumes the formulation comes from upstream, with suitable containers and a qualified process and site. It does not model ingredient manufacture. Neither source establishes that this hypothetical backup would have prevented the 2011 shortage.
A “pod” is a small production unit. Here it receives prepared liquid and fills final containers. Follow fictional Product A through filling and review, then compare extra stock with local production during a delivery gap. Quantities, shelf life and timing are invented, not norepinephrine data or a replay of 2011. Run production, review and stock together across 30 days ↗
An independent explainer, not an official Cost Plus Drugs site.
The models are illustrations, not clinical or production guidance.
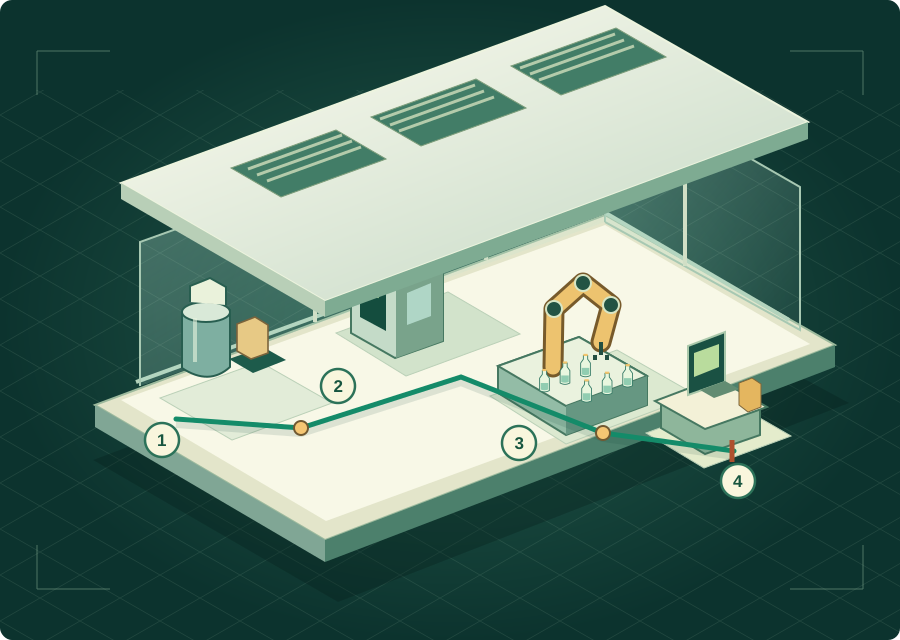
01 / INSIDE THE POD
Follow one batch.
FICTIONAL PRODUCT A · A fill-finish example, not a norepinephrine process design.
- The physical batch
- Its record trail
- Can it leave?
The material changes. Its story travels with it.
Drag to explore. Progress is conceptual, not elapsed time.
Select a numbered station, or use the buttons to change the view.
02 / A FICTIONAL SUPPLY TEST
Stock up or make locally when deliveries stop?
A hospital needs fictional Product A every day. Compare extra stock with local production during the same delivery gap. Filled batches add usable supply only after review. Quantities, shelf life and timing are invented, not norepinephrine data.
Three plans. The same daily need.
Supply outcomes
No demand counted before day1.
Deliveries only
No extra stock or production
0units missed
0 supplied in time
Deliveries + reserve
420 extra units held before day 0
0units missed
0 supplied in time
Deliveries + local
Production waits for inputs and release
0units missed
0 supplied in time
Missed need accumulates.
units not supplied in timeSCHEMATIC · three alternative supply plans, not a factory layout
DELIVERIESA · DELIVERIES ONLY200end-of-day stock
STOCKB · + RESERVE620end-of-day stock
LOCAL SUPPLYC · + LOCAL200end-of-day stock
REQUIRED
C · Deliveries + local · Day 0
Choose a plan aboveSolid stacks: stock left. Rust trays: expired today. Rust dots: days with unmet need. Vehicles and moving markers are symbolic, not quantities or physical rates.
The same day controls the scene, chart and result cards.
The reserve is already on the shelf. Local supply must wait for inputs, production and release.
Invented amounts of one medicine. These are not doses or patient counts. Costs are not modeled.
Does local mean independent?
What if local inputs share the disruption that stops finished medicine?
| Input route | Inputs here | First release | Local unmet day 30 |
|---|---|---|---|
| Separate | |||
| Shared |
Transport assumptions
Fictional Product A, not the historical shortage. Reopening permits arrival with no added travel time. Pre-positioning assumes suitable inputs can be obtained and stored; input shelf life and procurement lead time are not modeled. A suitable site and satisfactory release are still required. A different route does not remove a common ingredient shortage or a quality failure. Change the planned input date in Assumptions.
What changes the answer?30-DAY
STRESS TEST
BOTH CASES THROUGH DAY 30
Outline = before · solid = now. Same scale: all 30 days of need.
Why do the totals change? Trace a turning point
Day 0: stock is not service yet.
Opening stock − expiry + arrivals = available → meet today’s need → stock left.
| Plan | Opening | − Expired | + Arrived | = Available | Supplied / needed | Unmet today | Left |
|---|---|---|---|---|---|---|---|
| Deliveries only Selected | 200 | 0 | 0 | 200 | 0 / 0 | 0 | 200 |
| + Advance reserve Selected | 620 | 0 | 0 | 620 | 0 / 0 | 0 | 620 |
| + Local production Selected | 200 | 0 | 0 | 200 | 0 / 0 | 0 | 200 |
A missed day leaves a mark.
Rows: deliveries only / + reserve / + local.
TRY AN EXAMPLE
Examples reset the assumptions. Controls recalculate the whole case; they do not approve a live batch.
Change assumptions or inspect the detailed accounting
Both plans start with the same stock and receive the same outside deliveries. Only one adds local backup.
Deliveries only: stock left now 200
With reserve: stock left now 620
With local production: stock left now 200
- Inputs
- Make
- Evidence
- Release
First batch: waiting
- All local units held
- 0
- Released to date
- 0
Invented quantities and timings. Units of the same finished product, not doses. Assumed suitable site and product-specific process; not a Cost Plus forecast.
Preparation starts together
Then, one step at a time
THE POD LESSON, ON A CLOCK
This timing example assumes a satisfactory review.
By the day you choose, how much supply has each route made available at the destination?
First delivery day 3
300 units, then every 7 daysFirst release day 15
Prepare → qualify → make → reviewSaved setup → current at day 30
Saved: 8-day site work; supplies every 7 days.
Change one assumption to see what follows.
Arbitrary units, not doses. Invented quantities and timings; satisfactory review assumed. Not a Cost Plus forecast.
CHANGE ONE THING
Can a shorter setup help?
Shorten site work and watch which preparation bar finishes last.
FIRST LOCAL RELEASE / DAY 15
Arrival isn't production.
The destination needs a working site, equipment and people before qualification, production and release can follow.
5 days to move equipment; 4 for people; then 3 to qualify, 2 per batch and 2 for release review. Read the assumptions before treating a comparison as a conclusion.
03 / THE SCALE-OUT EXPERIMENT
Twice the pods. Twice the output?
You’re choosing what to expand: the small production units, called pods, or the checks they share. Add pods and see whether more output gets through. This separate model uses invented work units per cycle; it does not track stock, queues or release decisions. Connect those limits to a daily review queue and usable stock ↗
Shared utilities on
200200
This is an idealized rate ceiling, not a production forecast or Cost Plus specification. It does not track waiting batches or clear them after an outage.
BOTTLENECK / PODS
The pods set the pace.
Your 2 working pods could supply 200 units. The checks can handle 240.
Which change helps from here?
Would adding two more pods double what gets through?
This model shares utilities across all pods. Real plants may separate systems or provide backups.
OPTIONAL / WHEN THE PRODUCT CHANGES
One patient. What changes?
The shortage case repeats an established medicine. What changes if the product itself changes? Compare that job with developing a therapy for one person.
PRODUCT A · QUESTION 1 OF 3
Repeat an established product.
Product A stays the same across these production runs. The process is established for this product and setting; each batch still needs its own controls, records and quality review.
FDA’s individualized-therapy framework remains draft guidance, not for implementation. It is not approval of a candidate or a pod. These cases are conceptual, not a clinical decision tool.
05 / THE EVIDENCE
What do we know so far?
Follow a statement back to its source. That lets you distinguish what’s been described, what’s been tested and what still needs an answer.